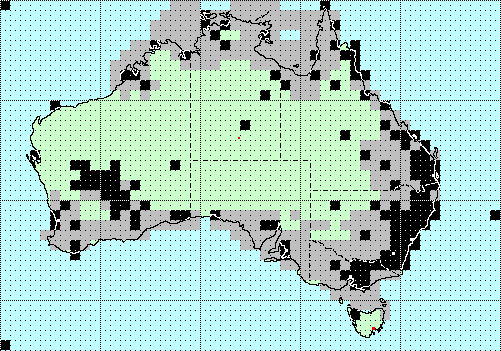
Order Phasmatodea,
Distribution Map

1+0=1 0+1=1 0+1=1 0+1=1 0+1=1 0+1=1 0+1=1 0+1=1 0+1=1 4+0=4 0+1=1 0+1=1 0+1=1 0+2=2 2+0=2 0+1=1 0+2=2 0+2=2 0+1=1 0+2=2 0+2=2 0+2=2 0+2=2 0+1=1 0+1=1 0+1=1 0+1=1 0+1=1 0+1=1 0+1=1 0+1=1 0+1=1 0+1=1 1+0=1 0+2=2 4+1=5 0+3=3 0+3=3 0+2=2 0+2=2 0+1=1 0+1=1 0+1=1 0+2=2 0+1=1 0+1=1 1+0=1 0+1=1 0+2=2 0+1=1 0+1=1 0+1=1 0+2=2 2+1=3 0+2=2 0+2=2 1+1=2 0+1=1 0+1=1 0+2=2 0+1=1 0+1=1 0+1=1 0+1=1 1+1=2 0+2=2 0+1=1 0+1=1 0+1=1 0+2=2 0+1=1 1+0=1 0+1=1 0+2=2 0+2=2 0+2=2 0+1=1 0+1=1 0+1=1 0+1=1 0+2=2 0+2=2 1+2=3 1+0=1 0+1=1 0+1=1 0+2=2 0+1=1 1+0=1 0+1=1 0+1=1 0+1=1 0+1=1 0+1=1 0+1=1 0+1=1 0+1=1 0+1=1 0+1=1 0+1=1 0+1=1 1+1=2 0+2=2 0+2=2 1+0=1 7+0=7 0+1=1 0+1=1 0+2=2 0+2=2 0+1=1 0+1=1 0+1=1 0+1=1 0+1=1 0+1=1 0+1=1 0+1=1 0+1=1 0+1=1 0+2=2 0+1=1 0+1=1 6+1=7 0+1=1 2+0=2 2+0=2 0+1=1 1+0=1 0+1=1 0+1=1 0+2=2 1+1=2 0+1=1 6+0=6 2+0=2 0+1=1 0+1=1 0+1=1 2+1=3 0+1=1 1+0=1 0+1=1 0+1=1 0+1=1 1+0=1 0+2=2 0+1=1 0+1=1 0+1=1 1+0=1 0+1=1 0+1=1 0+1=1 1+1=2 0+2=2 1+0=1 0+1=1 2+2=4 0+3=3 0+3=3 1+0=1 4+2=6 0+3=3 0+3=3 1+0=1 0+2=2 1+1=2 3+4=7 1+2=3 0+1=1 0+1=1 0+3=3 0+3=3 1+1=2 0+6=6 1+2=3 1+0=1 1+0=1 0+2=2 0+3=3 0+3=3 0+3=3 3+2=5 1+6=7 0+1=1 1+0=1 1+0=1 1+0=1 1+0=1 0+1=1 0+1=1 1+1=2 0+2=2 0+4=4 1+2=3 4+5=9 1+0=1 1+0=1 1+1=2 1+0=1 1+0=1 0+1=1 0+1=1 0+2=2 0+3=3 1+2=3 5+4=9 8+1=9 1+0=1 1+0=1 1+0=1 1+0=1 2+0=2 0+1=1 1+0=1 0+1=1 0+1=1 1+1=2 0+4=4 0+4=4 3+4=7 10+1=11 0+1=1 0+1=1 0+1=1 1+0=1 2+0=2 1+0=1 0+1=1 0+2=2 0+3=3 1+2=3 3+5=8 0+2=2 0+3=3 1+0=1 0+1=1 0+1=1 2+0=2 1+1=2 0+1=1 1+0=1 2+0=2 1+0=1 0+2=2 1+1=2 0+3=3 3+1=4 4+1=5 3+0=3 7+4=11 0+4=4 0+1=1 2+0=2 0+2=2 1+1=2 0+1=1 0+1=1 0+1=1 1+0=1 1+0=1 0+1=1 2+0=2 0+1=1 0+1=1 0+1=1 0+1=1 0+1=1 0+1=1 0+1=1 0+1=1 0+1=1 0+1=1 2+2=4 4+0=4 1+3=4 2+0=2 4+2=6 1+0=1 4+0=4 1+5=6 0+7=7 1+1=2 0+2=2 0+1=1 0+1=1 0+2=2 0+2=2 1+2=3 0+2=2 0+2=2 0+1=1 0+1=1 0+1=1 0+1=1 0+1=1 0+1=1 0+1=1 0+2=2 0+2=2 1+1=2 1+1=2 0+1=1 0+1=1 0+1=1 0+1=1 0+1=1 0+2=2 0+2=2 0+4=4 1+3=4 1+5=6 4+3=7 2+1=3 0+1=1 0+5=5 0+4=4 0+1=1 0+1=1 0+2=2 0+2=2 0+3=3 0+3=3 0+2=2 0+1=1 0+1=1 0+1=1 0+2=2 0+2=2 0+2=2 0+1=1 0+1=1 0+1=1 0+2=2 1+3=4 0+3=3 0+3=3 1+1=2 4+2=6 9+0=9 0+4=4 0+4=4 1+3=4 0+3=3 0+1=1 0+1=1 0+1=1 0+1=1 3+1=4 0+1=1 0+1=1 0+1=1 0+1=1 0+1=1 0+1=1 0+1=1 0+2=2 0+2=2 0+3=3 2+1=3 4+2=6 1+0=1 1+0=1 0+1=1 0+1=1 1+2=3 0+1=1 0+1=1 0+1=1 0+1=1 0+1=1 0+1=1 0+2=2 0+2=2 0+4=4 2+0=2 2+0=2 3+0=3 0+1=1 0+1=1 0+1=1 0+1=1 0+1=1 1+1=2 0+1=1 1+3=4 1+0=1 1+0=1 1+0=1 1+1=2 1+0=1 0+1=1 0+3=3 0+3=3 0+3=3 1+3=4 1+3=4 1+0=1 0+1=1 0+2=2 0+3=3 0+1=1 0+3=3 0+1=1 2+2=4 1+2=3 0+1=1 0+1=1 0+1=1 0+1=1 0+1=1 0+1=1 0+1=1 0+1=1 0+1=1 0+1=1 1+0=1 0+1=1 94+0=94 No Sightings


Legend
Land
Water
Sighting
Projected
The distribution map is a hyper-linked index. By clicking on a highlighted area of the map, you may obtain a species list for that area. Actual sightings are separated from the projected species. The algorithm used to project the species distributions is the one used by ERIN's BIOCLIM software. The climate data on which the projection is based was supplied by the Australian Bureau of Meterology. The square in the bottom left corner isn't an island, it's the list of species which don't have any sightings recorded yet. If you have a collection with one of these species in it, or a paper describing one of these species, please let me know.

Copyright © 2000-2003 Peter Miller
This page was last changed 20-Sep-2006.
Up Top